Resin Documentationhome company docs
app server 
app server

health meters
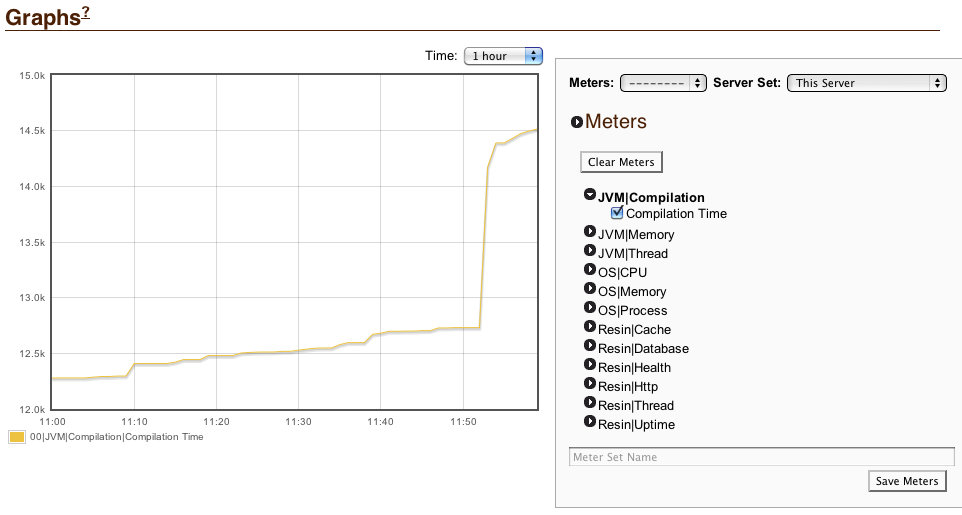
Health meters are a simple way to create visually pleasing graphs in /resin-admin. health.xmlMeters are configured as part of health.xml using CanDI to create and update Java objects. Refer to health checking configuration for a full description of health.xml. Resin 4.0.17 and later includes a full compliemnt of pre-configured JMX meters in health.xml. Example: importing health.xml into resin.xml
<resin xmlns="http://caucho.com/ns/resin"
       xmlns:resin="urn:java:com.caucho.resin">
  <cluster-default>
    ...
    <!--
       - Admin services
      -->
    <resin:DeployService/>

    <resin:if test="${resin.professional}">
      <resin:AdminServices/>
    </resin:if>

    <!--
       - Configuration for the health monitoring system
      -->
    <resin:if test="${resin.professional}">
      <resin:import path="${__DIR__}/health.xml" optional="true"/>
    </resin:if>
    ...
  </cluster-default>
</resin>
Note: Meter namesHealth meters are named using a concatenation of keys separated by pipe (|) characters, loosely organized from least specific to most specific. Since meter statistics are shared between each member in a Resin cluster, Resin will automatically prefix each meter name with the cluster node index to insure the name is unique between cluster members. The pipe character in the name provides a secondary benefit of helping to enhance the /resin-admin UI by categorizing meters into drill downs. Consider the following example. Example: meter naming
<cluster xmlns="http://caucho.com/ns/resin"
         xmlns:resin="urn:java:com.caucho.resin"
         xmlns:health="urn:java:com.caucho.health"
         xmlns:ee="urn:java:ee">

  <health:JmxDeltaMeter>
    <name>JVM|Compilation|Compilation Time</name>
    <object-name>java.lang:type=Compilation</object-name>
    <attribute>TotalCompilationTime</attribute>
  </health:JmxDeltaMeter>

</cluster>
In this example,  Virtually any local numeric JMX MBean attribute can be graphed using JMX meters. child of <cluster> javadoc <health:JmxMeter>
Creates a meter that graphs the current value of a numeric JMX MBean attribute.
Example: <health:JmxMeter> in health.xml
<cluster xmlns="http://caucho.com/ns/resin"
         xmlns:resin="urn:java:com.caucho.resin"
         xmlns:health="urn:java:com.caucho.health"
         xmlns:ee="urn:java:ee">

  <health:JmxMeter>
    <name>OS|Memory|Physical Memory Free</name>
    <object-name>java.lang:type=OperatingSystem</object-name>
    <attribute>FreePhysicalMemorySize</attribute>
  </health:JmxMeter>

</cluster>
child of <cluster> javadoc <health:JmxDeltaMeter>
Creates a meter that graphs the difference between the current and previous values of a numeric JMX MBean attribute.
Example: <health:JmxDeltaMeter> in health.xml
<cluster xmlns="http://caucho.com/ns/resin"
         xmlns:resin="urn:java:com.caucho.resin"
         xmlns:health="urn:java:com.caucho.health"
         xmlns:ee="urn:java:ee">

  <health:JmxDeltaMeter>
    <name>JVM|Compilation|Compilation Time</name>
    <object-name>java.lang:type=Compilation</object-name>
    <attribute>TotalCompilationTime</attribute>
  </health:JmxDeltaMeter>

</cluster>
Detecting AnomaliesMeters alone are useful for manual inspection in resin-admin since every meter can be graphed. However Resin provides an extremely useful automatic analysis tool called AnomalyAnalyzer. AnomalyAnalyzer looks at the current meter value, checking for deviations from the average value. So unusual changes like a spike in blocked threads can be detected. child of <cluster> javadoc <health:AnomalyAnalyzer>
AnomalyAnalyzer examines a meter value, checking for deviations from the average value. So unusual changes like a spike in blocked threads can be detected, logged, and trigger health actions.
Example: <health:AnomalyAnalyzer> in health.xml
<cluster xmlns="http://caucho.com/ns/resin"
         xmlns:resin="urn:java:com.caucho.resin"
         xmlns:health="urn:java:com.caucho.health"
         xmlns:ee="urn:java:ee">

  <health:JmxMeter>
    <name>JVM|Thread|JVM Blocked Count</name>
    <objectName>resin:type=JvmThreads</objectName>
    <attribute>BlockedCount</attribute>
  </health:JmxMeter>

  <health:AnomalyAnalyzer>
    <meter>JVM|Thread|JVM Blocked Count</meter>
    <health-event>caucho.thread.anomaly.jvm-blocked</health-event>
  </health:AnomalyAnalyzer>

  <health:DumpThreads>
    <health:IfHealthEvent regexp="caucho.thread"/>
    <health:IfNotRecent time="15m"/>
  </health:DumpThreads>

</cluster>
Standard Anomaly detectionThe default health.xml configures some general anomaly analysis. In general, anomaly detection can tell you when something went wrong in the server. It looks for unusual spikes of behavior by recording an average baseline for a value and then looking for deviations.
Reacting to AnomaliesThe <health-event> attribute of AnomalyAnalyzer allows us to tie health actions to a detected anomaly by using the <health:IfHealthEvent> condition. child of <cluster> javadoc <health:IfHealthEvent>
Causes an action to fire in response to a matching health event. This is usually used in combination with <AnomalyAnalyzer> with a <health-event> attribute.
Example: <health:IfHealthEvent> in health.xml
<cluster xmlns="http://caucho.com/ns/resin"
         xmlns:resin="urn:java:com.caucho.resin"
         xmlns:health="urn:java:com.caucho.health"
         xmlns:ee="urn:java:ee">

  <health:JmxMeter>
    <name>JVM|Thread|JVM Blocked Count</name>
    <objectName>resin:type=JvmThreads</objectName>
    <attribute>BlockedCount</attribute>
  </health:JmxMeter>

  <health:AnomalyAnalyzer>
    <meter>JVM|Thread|JVM Blocked Count</meter>
    <health-event>caucho.thread.anomaly.jvm-blocked</health-event>
  </health:AnomalyAnalyzer>

  <health:DumpThreads>
    <health:IfHealthEvent regexp="caucho.thread"/>
    <health:IfNotRecent time="15m"/>
  </health:DumpThreads>

</cluster>
|